Disadvantaged Communities (%) by Chicago Neighborhood
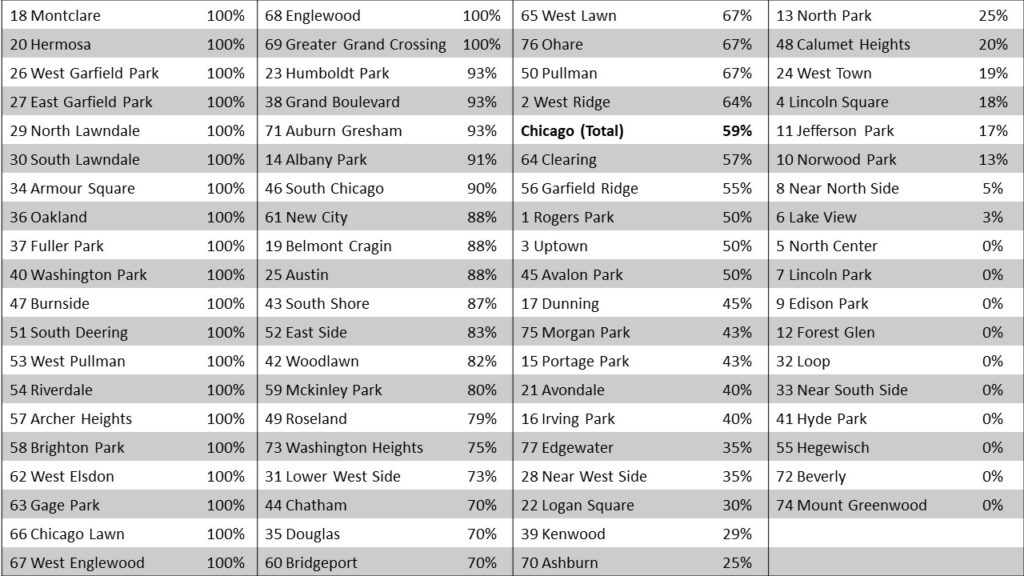
We previously posted on the disparities between neighborhoods in Chicago with respect to the the Justice40 initiative for disadvantaged communities. For the city as a whole, 59% of census tracts have been designated as disadvantaged communities. The legacy of redlining, disinvestment, and environmental injustice has resulted in the concentration of many disadvantaged communities in the South and West Side of Chicago’s 77 historical neighborhoods.
These data are not directly available to Chicago grant seekers from the Climate and Economic Justice (CEJ) Screening Tool. The data must be downloaded and merged/matched to a crosswalk with census tracts assigned to each neighborhood (available from the City of Chicago). Once a variable to identify the Chicago neighborhoods has been added, then we can see the number of census tracts in each neighborhood flagged as disadvantaged communities for Justice40 grant funding.
More importantly, we can can explore the data to learn what specific burdens each community confronts. In the example below, West Pullman on the South Side of Chicago, has 30,000+ American citizens (2010 US Census) in 9 Census tracts, 100% of which have been designated as disadvantaged communities. In addition, the neighborhood is one of Chicago’s predominantly Black communities (90% of the population), meaning that an effective project design and logic model will likely require activities to address the city’s legacy (and current agencies) of structural racism.
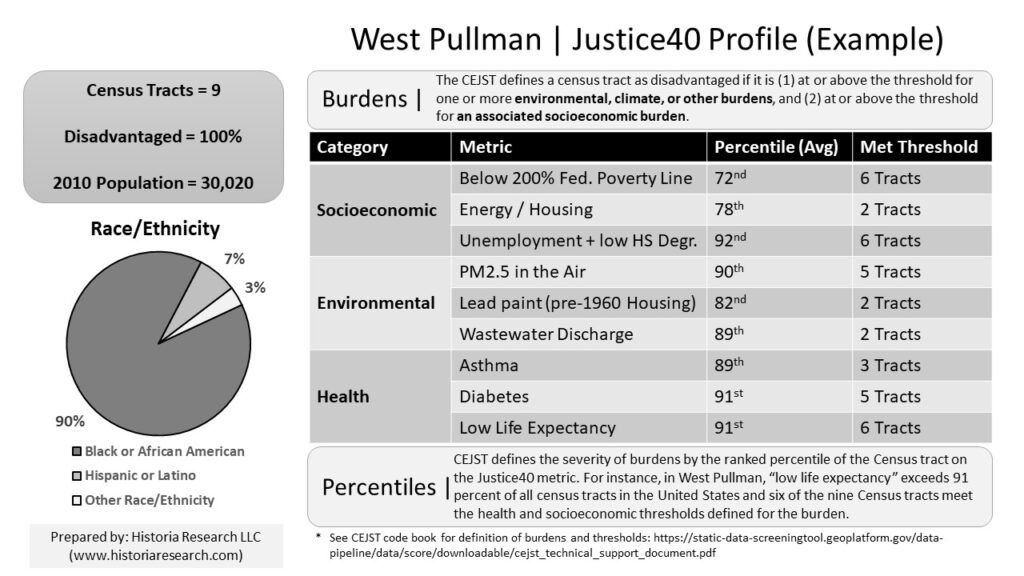
Burdens are defined by thresholds on both environmental, climate, or other burdens and an associated socioeconomic burden. With the CEJ data matched to City of Chicago neighborhoods, we see how many (and which) Census tracts met specific thresholds for burdens. For instance, most tracts in West Pullman met thresholds for poverty, unemployment, air quality, diabetes and life expectancy burdens. The burdens are not universal (9 of 9), so we also learn that each census tract contends with its own unique constellation of burdens.
Nonetheless, the percentiles (average, not weighted by population) serve to indicate the severity of burdens in the neighborhood as a whole even where Census tracts have not met the threshold for burdens. For example, while only 2 Census tracts meet the threshold for lead paint in residential housing (pre-1960 structures), across all 9 tracts the average percentile is 82 — meaning that exposure to lead paint is generally more likely than for 80+ percent of all census tracts in America.
Access to these specific data on CEJ burdens in disadvantaged communities will help Chicago grant applicants to provide detailed statements of need for priority populations, make accurate projections for the percentage of the grant participants likely to be exposed to specific burdens in the neighborhoods, and help principal investigators craft SMART(IE/ER) project goals for program evaluations. The above example (table) represents only a handful of the 100+ variables available in the CEJ Screening Tool data.
Last updated: March 1 2024